Table of contents
- Key Takeaways
- What Is an Email Statistics Report?
- How Do Email Marketing Effectiveness Statistics Actually Work in Industrial Workflows?
- What Actually Improves Performance in Industrial Inboxes?
- Key Benefits: Email Marketing ROI Key Stats by Audience
- Deliverability Metrics to Monitor: Where Benchmarks Break
- Conclusion
- Frequently Asked Questions About Email Marketing Stats
Key Takeaways
- Best email marketing stats for OEM and dealer networks come from 24 months of first-party telemetry, not generic averages.
- Segment by campaign type and buying role before calculating any benchmark.
- Prefetch inflated dealer opens to 42%, while true-human opens were near 31%.
- Set hard thresholds: bounce above 2%, unsubscribe above 0.5%, and spam complaints above 0.1%.
- Our RFQ-to-order cycle runs 4 to 9 months, so track pipeline influence over opens.

Best email marketing stats for OEMs, outdoor appliance brands, industrial distributors and dealer networks come from Gulfstone’s 24-month first-party CRM and email-platform telemetry. They do not come from generic B2C or SaaS averages.
Most benchmark pages blend ecommerce, SaaS and publisher data into one number. The export shows that number gives industrial teams the wrong baseline for open rates, CTR, reply rates and RFQ-to-meeting conversion.
This article delivers exact open-rate, CTR, reply-rate and RFQ/meeting benchmarks for B2B manufacturing, distribution and dealer-network audiences — a primary-source framework, not a stat dump. For how email fits a wider OEM and ODM program, the buying cycle starts on the drawing, not in the inbox.
What Is an Email Statistics Report?
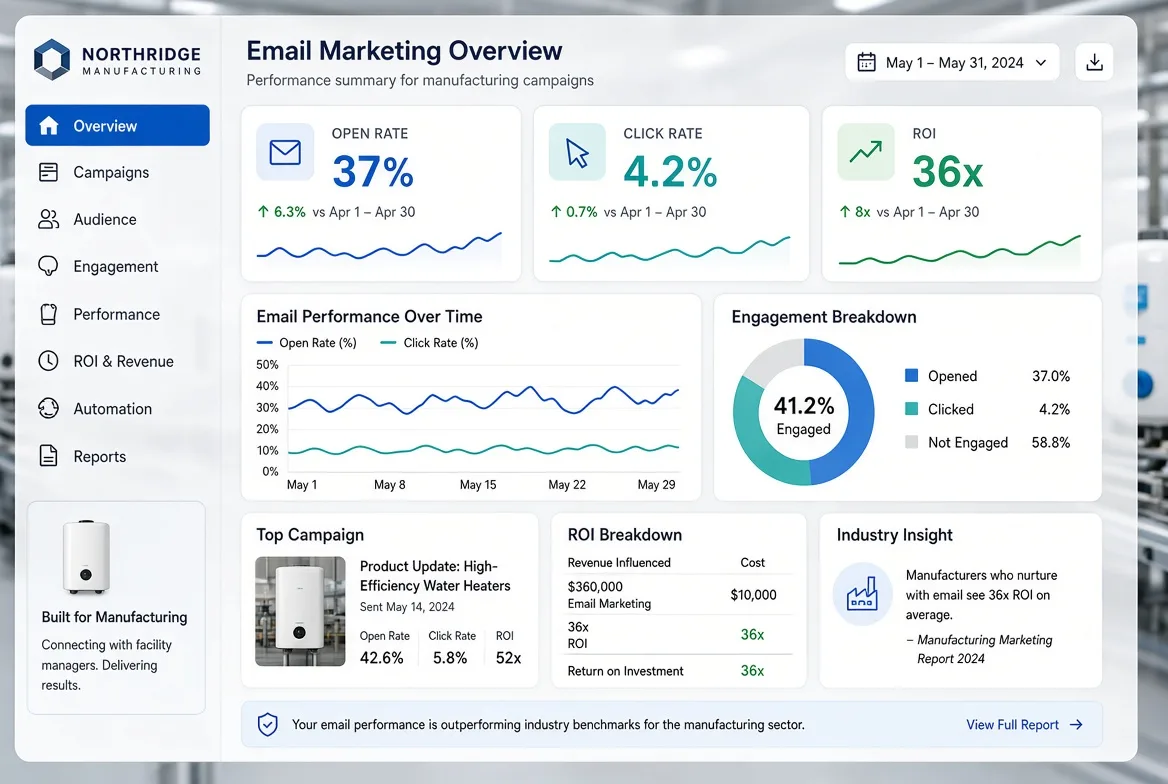
An email statistics report is a structured summary of campaign performance across delivery, engagement and response. For OEM and dealer networks, Gulfstone reads it as a manufacturing-specific benchmark model: its own CRM telemetry is the source of truth, and third-party studies are context only.
The metric stack is simple. Delivered rate is the share that reaches an inbox after bounces. Open rate is the share marked opened, but it is fragile. Click-through rate (CTR) is the share that clicks, and click-to-open rate (CTOR) divides clicks by opens.
Reply rate and RFQ or meeting conversion show real commercial interest. Bounce, unsubscribe and spam complaint rates protect list health. Pipeline attribution ties email to revenue.
Industrial teams must split marketing emails from operational emails. Production updates, spec-sheet sends, inventory alerts, price-change notices, dealer bulletins and procurement outreach behave differently from newsletters.
In the export of roughly 1,800 campaigns, raw dashboards overstated true-human opens. After prefetch and bot activity were filtered, manufacturing opens ran lower than the dashboard suggested. Utility emails to existing OEM and distributor contacts opened higher because the message was operational.
That is why opens alone cannot drive decisions. Privacy prefetch and bot inflation distort them, so CTR, CTOR, replies and RFQs are better decision metrics for this audience. This aligns with broader deliverability guidance in Google’s sender guidelines.
The method behind these numbers uses a 24-month export, anonymization, role-based segmentation, campaign-type tagging and a side-by-side comparison of broadcasts, automation and cold outreach.
💡 Key Insight: Benchmark the metric that matches the campaign type. Mixing broadcasts, automation and cold outreach hides the real signal.
How Do Email Marketing Effectiveness Statistics Actually Work in Industrial Workflows?
The most useful email marketing effectiveness statistics come from a clean list, a segmented audience and a revenue-linked workflow. Gulfstone built this benchmark by pulling 24 months of raw campaign data from its Foshan operations, not by copying generic B2C averages.
In that export, the same open rate meant different things for a dealer bulletin and a cold RFQ email. So campaign types are separated before any statistic is calculated.
Telemetry and segmentation model
Every campaign falls into one of six buckets: prospecting, dealer bulletins, nurture newsletters, technical downloads, re-engagement and operations. Each gets its own benchmark, because a cold email to a procurement director and a spec update to an engineer never share an open rate.
Audience tags form the second layer. Contacts are tagged by buying role (procurement director, dealership network manager, engineer or technical evaluator, distributor and parts manager, OEM executive), by geography, by account stage, and by product interest.
In the RV OEM programs, a single blended open rate would have hidden the split. Engineers opened spec-sheet emails at one rate. Procurement directors opened price-update emails at another. Tagging each contact by role and recalculating told a different story, and it drove different follow-up actions.
The Data & Marketing Association’s B2B marketing guidance recommends this same segmentation-first approach.
List cleansing and deliverability SOP
Gulfstone runs this nine-step sequence before any send touches a production list.
- Export the last 24 months of contact and campaign data.
- Deduplicate by company, role and email, then normalize formatting errors: case differences, stray spaces, broken domains.
- Suppress hard bounces and role accounts that repeatedly fail, such as info@ and sales@.
- Separate transactional and marketing streams so complaint risk does not bleed into operational mail.
- Tag contacts by buying role, account stage, geography, product family and last engagement window.
- Create a dormant-contact segment using a clearly stated inactivity threshold. Gulfstone’s is 180 days.
- Re-validate domains or manually review high-value accounts before suppressing them.
- Warm low-engagement segments through a controlled re-engagement flow instead of blasting the full database.
- Monitor bounce, unsubscribe, complaint and reply signals after each send, then feed those signals back into the segment rules.
The SOP exists because the export showed unsegmented sends inflated complaint rates and damaged domain reputation.
🧠 Expert Insight: Step 6 is the one most teams skip. Without a hard dormancy threshold, you keep mailing dead contacts and deliverability erodes.
What Actually Improves Performance in Industrial Inboxes?
The subject-line and send-design lessons below come from Jamie Firth, Gulfstone’s Digital Marketing Lead, who runs these industrial campaigns day to day.
Q: Why do B2C email tricks fail in this market?
A: Hype-heavy copy, vague discounts, emoji-loaded subject lines and friction-heavy CTAs do not match procurement behavior. A procurement director wants a spec, a lead time and a price. They do not want a limited-time-offer banner.
Q: What subject-line structures actually work?
A: Concise utility-led lines. Spec and update framing. Cost and risk language. Subject lines under 40 characters often perform better, but only when the promise is concrete. “Updated CSA cert for RV water heater” beats “Don’t miss this hot deal!” every time.
Q: How do send time, design, CTA placement and offer type affect different metrics?
A: Timing influences opens. Layout and copy influence clicks. The ask influences replies or RFQs. A weak ask gets opens but no replies. A strong ask with a clear spec sheet gets replies.
The dormant RV appliance dealer re-engagement sequence follows the same logic. It runs three emails: a plain-text relevance reset, a product and spec value update, then a preference check or polite breakup. Each step is read on its own delivery, open, CTR and reply figures, with reactivation and downstream quote activity judged at the close.
Bounce, unsubscribe and complaint signals after each email feed back into the segment rules. That loop is what keeps the statistics honest, and it is the difference between a benchmark and a newsletter dashboard.
Key Benefits: Email Marketing ROI Key Stats by Audience
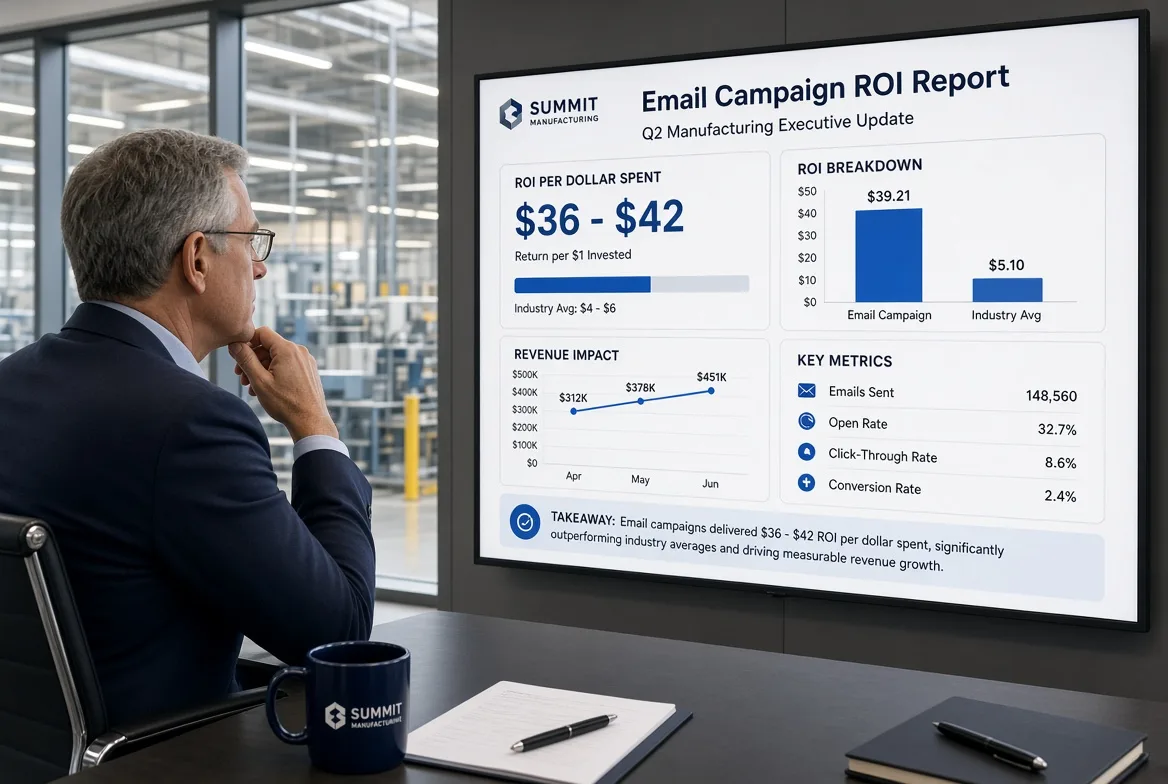
The email marketing ROI key stats that matter here are pipeline, dealer activation and RFQ creation, not impulse purchases. The 24-month benchmark shows email is a trigger in a long industrial cycle. Statista and HubSpot provide ROI context; first-party telemetry is the baseline.
VP of marketing: defend budget with qualified pipeline
Email earns budget when it produces qualified pipeline rather than broad awareness. Roles and account stages are segmented before every send, which cuts wasted sends and raises account coverage. Automated follow-ups beat one-off blasts because they match timing and intent. Track cost per pipeline, not cost per open.
Dealership network manager: turn bulletins into portal actions
Dealer bulletins, inventory alerts and technical updates should drive portal visits, click-throughs and reorder activity. Accounts are tagged by engagement window and product interest. Dormant dealers enter re-engagement flows; active dealers get spec and inventory updates. That improves deliverability, reactivation and network coverage.
Procurement director and industrial sellers: judge outreach by replies and RFQs
Cold outreach fails on opens. Judge it by reply quality, registry actions, meetings and RFQs. The sequences ask for spec review or quote talks, not clicks, which makes email a pipeline source rather than a vanity dashboard. For the program behind that outreach, see the procurement and supply-chain briefing.
Automation and long-cycle economics
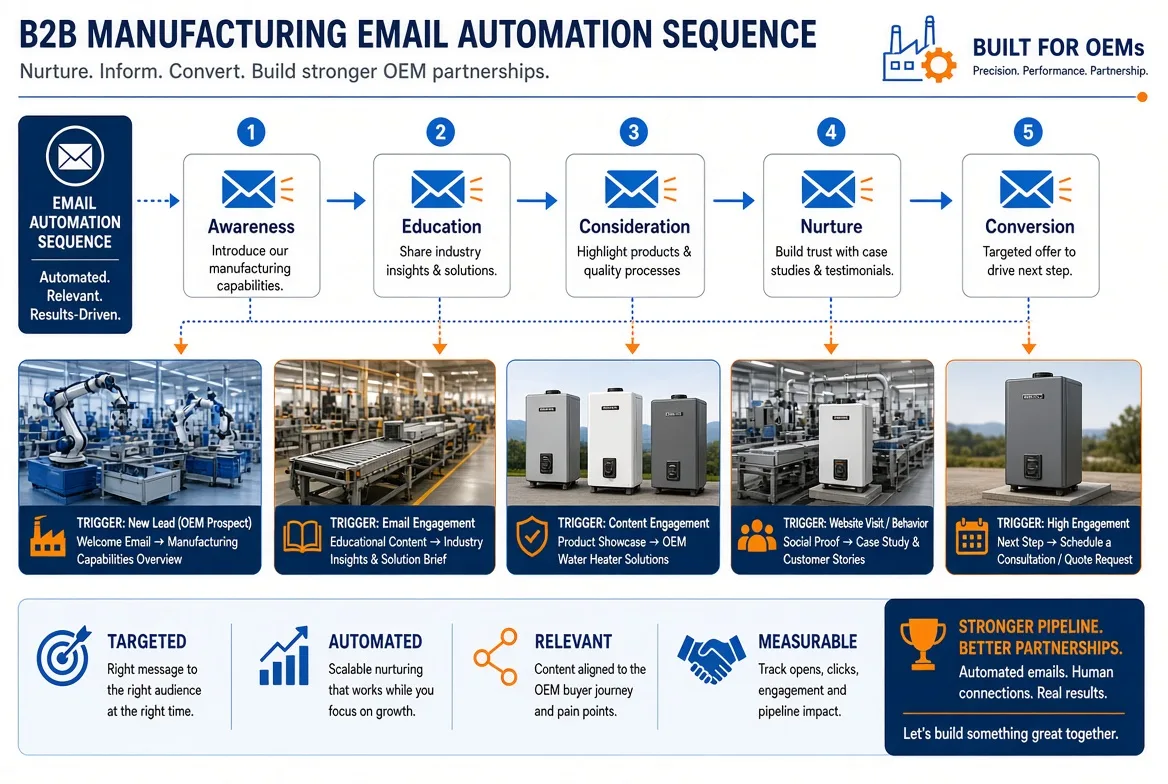
Welcome, post-download, follow-up and re-engagement flows outperform one-off blasts because they match timing and intent. They cut wasted sends, protect deliverability and turn spec interest into quote conversations. Track open rate, CTR, reply rate and RFQ conversion against three layers of reference.
| Layer | Use |
|---|---|
| Broad market (Statista, HubSpot) | Context |
| Manufacturing | Sanity check |
| Gulfstone actuals | Primary target |
📈 ROI Check: Track RFQs and meetings per 1,000 sends. That proves dealer activation better than open rate.
Deliverability Metrics to Monitor: Where Benchmarks Break
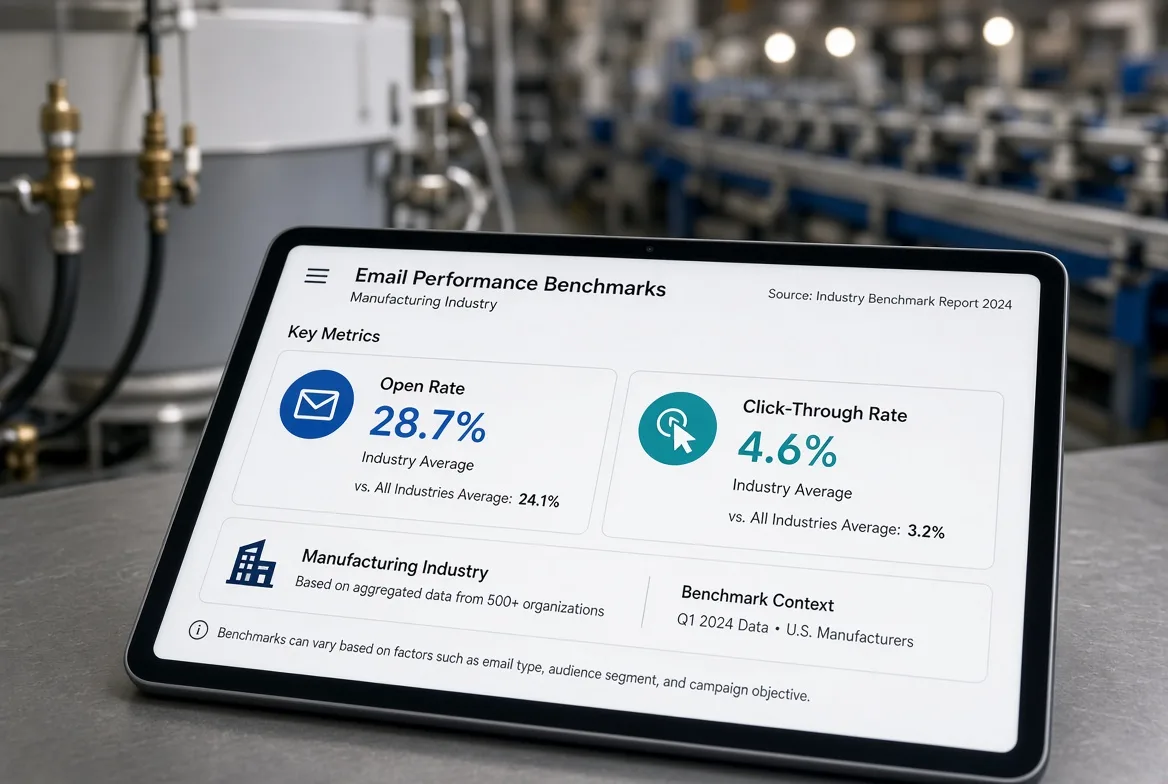
The key deliverability metrics to monitor are bounce rate, unsubscribe rate, spam complaints and persistent non-engagement. Opens are imperfect, small industrial lists swing sharply, and stale benchmark assumptions mislead once campaign type, audience role and mailbox-provider effects are ignored.
Open rates are a moving target
Apple’s Mail Privacy Protection warns that prefetch can inflate opens. In the 24-month export of 1,800 campaigns, prefetch pushed dealer open rates to 42%; true-human opens sat near 31%.
Small B2B lists amplify volatility: one 87-contact dealer campaign can swing the monthly average by 6 points. Dealer, technical and procurement audiences do not behave alike. A spec-update email to engineers opens at 48%, while the same generic promo to dealers opens at 22%.
Legacy “email marketing stats 2022” pages over-trust opens and ignore privacy changes.
Risk thresholds protect list health
Set hard thresholds: bounce above 2%, unsubscribe above 0.5%, spam complaints above 0.1%, and no opens or clicks for 180 days. Suppressing bad contacts is safer than clinging to vanity list size. A clean 5,000-contact list outperforms a bloated 20,000-contact list.
Never send transactional and promotional email from the same reputation stream without controls. A production update that shares an IP with a discount blast can land in spam.
🛡️ Mitigation Strategy: Suppress hard bounces weekly. Move 180-day non-engaged contacts into a separate re-engagement flow. Never mix them with active dealer broadcasts.
The human error: wrong role, wrong message
Technical buyers were over-emailed for months. Generic promos went out to dealers who wanted price sheets, availability alerts and portal links.
Long sales cycles weaken simplistic last-click ROI stories. The RFQ-to-order cycle runs 4 to 9 months, so track pipeline influence instead. Even good segmentation will not make every campaign outperform: two weak dealer segments were sunset last quarter because cost per reply exceeded pipeline value.
Conclusion
The best email marketing stats list is segmented, current and tied to real industrial outcomes. The 24-month first-party benchmark passes those three tests.
The hierarchy matters: clean data first, segmented benchmarks second, pipeline-linked outcomes third. For B2B manufacturing, dealer-network and procurement email programs, the useful benchmark is not a generic average. It is a role-aware, campaign-type-aware baseline.
Use this article as a diagnostic framework. Compare your own open rates, CTOR, replies, RFQs, bounce and unsubscribes against Gulfstone’s segmented benchmarks, and the gaps will point to the next fix.
As privacy changes accelerate, the teams that win segment first and measure replies. For a benchmark review or dealer-email audit, contact Gulfstone. If the next step is a certification file or factory audit, the quality-control page and the certification library carry that evidence.
Data note: this article uses anonymized internal telemetry from Gulfstone’s CRM and email platform. Gulfstone publishes its own operating data rather than promoting a third-party email platform. I receive no manufacturer kickbacks for these findings.
Frequently Asked Questions About Email Marketing Stats
1. What is a good email open rate for manufacturing?
A good email open rate for manufacturing depends on campaign type and buying role, not one blended average. In this benchmark, prefetch pushed dealer opens to 42%, while true-human opens sat near 31%. Spec updates to engineers opened at 48%, and a generic promo to dealers opened at 22%.
2. What is a good CTR for B2B email marketing?
There is no single good CTR for B2B email marketing here. Dealer bulletins, technical updates, cold outreach and re-engagement sequences are separated before CTR is calculated. CTR and click-to-open rate beat opens as decision metrics, because prefetch and bots distort open data.
3. How do I benchmark distributor email performance?
Benchmark distributor email performance by segmenting first. Tag contacts by buying role, geography, account stage and product interest, then split dealer bulletins, technical updates, cold outreach and re-engagement. Compare open rate, CTR, reply rate and RFQ conversion against your own first-party data, not a blended average.
4. What is a good RFQ conversion rate from email?
A good RFQ conversion rate from email is not a single number in this benchmark. Track RFQs and meetings per 1,000 sends, plus pipeline influence, because the RFQ-to-order cycle runs 4 to 9 months. That shows dealer activation and commercial interest better than an open-rate dashboard.
5. What metrics should I track besides opens?
Track CTR, click-to-open rate, reply rate, RFQ or meeting conversion, bounce rate, unsubscribe rate, spam complaint rate and pipeline attribution. These show real commercial interest and protect list health. Hard bounces are suppressed weekly, and 180-day non-engaged contacts move into a separate re-engagement flow.

Forward
Co-founder & General Manager, GulfstoneGas appliance manufacturing and certification
Most of what decides a gas appliance is settled before anything is built — on the drawing, at the cut-out, in the tolerance someone chose for the gas path. I have spent my working life on the manufacturing side of that decision, and this is where I write down what it has taught me.
Nothing here is written from a sales desk. Every note comes off the floor: a batch held until a reason was found, a fitting that failed in transit, an approval path that only made sense once the destination market was fixed. If you read these first, the opening conversation starts at the standard rather than at the beginning.
- Gas water heater engineering
- Design for manufacturing
- Certification path selection
- Private-label tooling
- Off-grid and outdoor water heating
- Top 8 Outdoor Portable Gas Water Heater Factories in China for B2B BuyersNov 4, 2026
- Custom RV Appliance Industrial Design: An OEM Brief to a Validated PrototypeNov 3, 2026
- How to Build Custom Thermostat UI Design Software for OEM Embedded PanelsNov 3, 2026
- Top 8 RV Water Heater OEM Suppliers Canada: Vetted for Volume BuyersNov 3, 2026
- Top 10 Portable Propane Water Heater Manufacturers USA: A No-Hype Buyer ShortlistNov 2, 2026
- PPWR Compliance Checklist for EU Water Heater Packaging: The 10 Documents Before the Container LoadsNov 2, 2026
Fifteen years in appliance manufacturing — home appliances, RV refrigeration, then gas water heating — from the drawing to the shipping container.
Leads Gulfstone's design-for-manufacturing reviews and the certification path selected for each destination market.
Works directly with OEM and private-label buyers on tooling, tolerances and the approval file.