Table of contents
Key Takeaways
- Social media statistics are useful only when they tie to buying behavior, supplier trust or pipeline progression.
- Optimize for opportunity rate and RFQ influence, not reach, impressions or likes.
- Certification explainers drove 42% of RFQs in a nine-month enterprise campaign teardown.
- Of surveyed buyers, 81% review current certification files before shortlisting a supplier.
- Only 11% of surveyed buyers check how often a supplier posts.
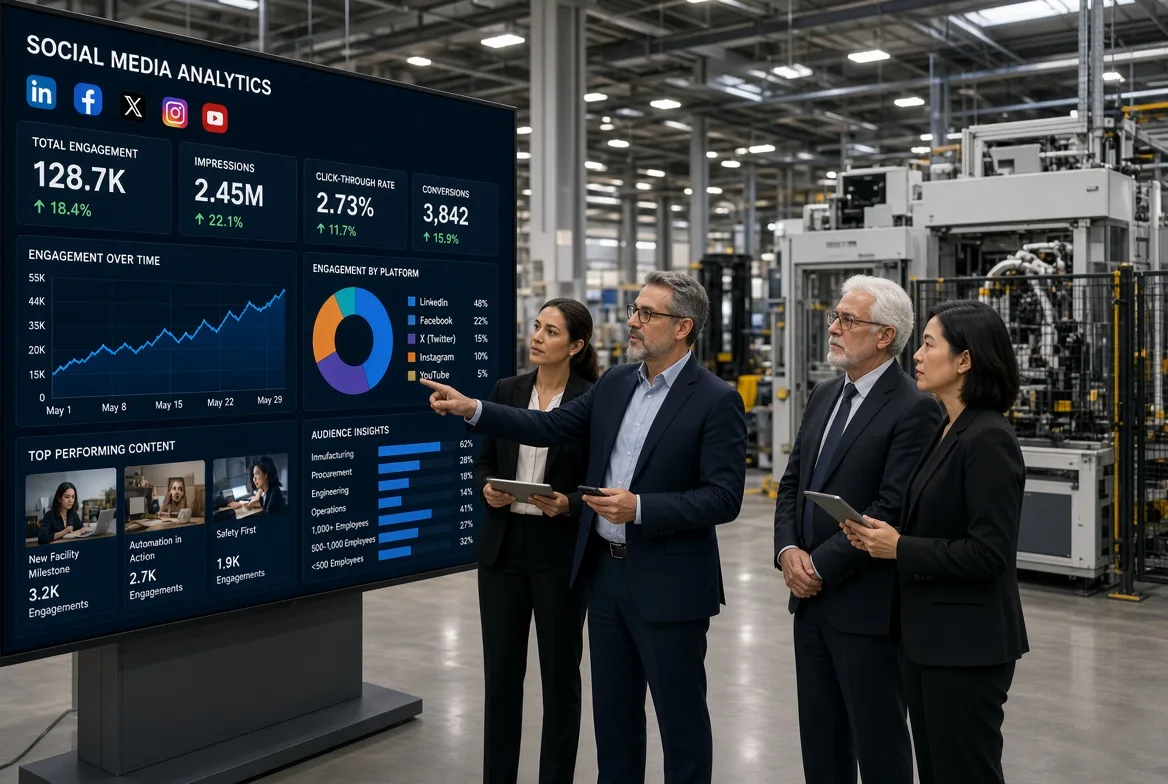
Social media is not an afterthought in industrial B2B. Its statistics matter only when they change shortlisting behavior, deal velocity or perceived supplier risk, and procurement rarely cares about raw likes. The buyer wants to know whether content helped them discover, validate and shortlist a supplier before an RFQ.
This is not a consumer social-media roundup. It is an executive reading of social media metrics for manufacturing, logistics and OEM/ODM programs, drawn from a 1,250-buyer procurement survey run in April and May 2024, a nine-month campaign teardown and an interview with Kingsley, Gulfstone’s Operations manager.
The survey describes activity; the teardown and the interview show where leadership attention should go. For a wider view of how supplier positions are built, see our OEM and ODM program guide and the procurement and supply chain briefing.
What Does Each Social Media Metric Mean?
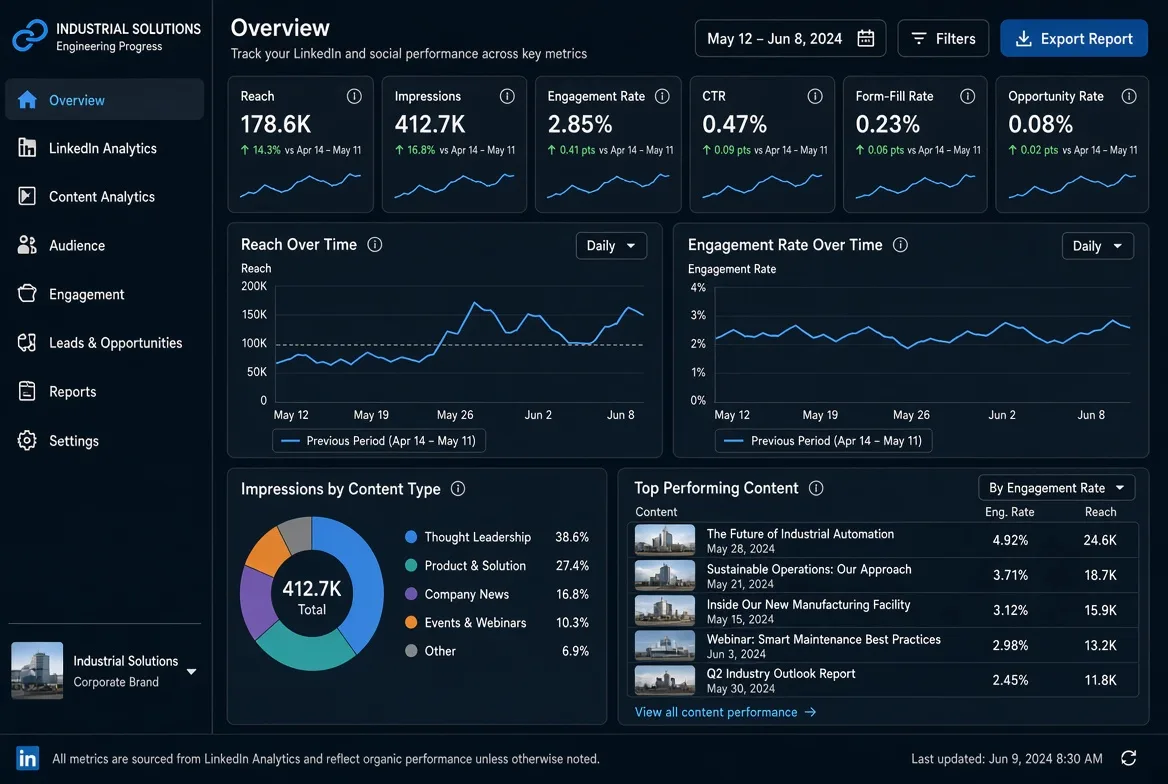
Every dashboard label maps to a measurable signal: reach, attention, interaction, traffic, lead capture and revenue influence. Split the dashboard before you read it, because account-level health covers follower growth, impressions, reach and audience composition.
Content-level performance covers engagement rate, video retention, clicks, click-through rate, form-fill rate and conversion rate. Six pairings carry most of the confusion in executive reviews.
- Reach vs. impressions: reach counts unique people. Impressions count every appearance, including repeat views.
- Engagement vs. engagement rate: engagement counts actions such as likes, comments and shares. Engagement rate is engagements divided by reach or impressions.
- Clicks vs. CTR: clicks count link presses. Click-through rate is clicks divided by impressions.
- Leads, MQLs and SQLs: leads are raw contacts. MQLs match the target customer profile. SQLs carry confirmed budget and buying intent.
- Cost per lead vs. opportunity rate: cost per lead is spend divided by leads. Opportunity rate is SQLs divided by leads.
- Assisted pipeline vs. last-click: assisted pipeline credits social for any touchpoint before close. Last-click credits only the final touchpoint.
The tiles at the top of a platform dashboard read like peer benchmarks; they are not. Industrial teams should not benchmark against consumer creators, and a niche manufacturing page can post less volume while attracting stronger commercial intent.
A good number depends on audience quality, deal size and buying stage. For Gulfstone’s sales team, form-fill rate and opportunity rate predict pipeline quality better than raw reach, so when an importer asks whether the channel works, the answer is opportunity rate, not likes.
That context rule is not local practice. The Interactive Advertising Bureau’s measurement guidelines make the same point: a statistic means something only against similar firms, similar platforms and similar funnel stages.
🌍 Real-World Context: Gulfstone’s Q3 Salesforce review showed flat LinkedIn reach. The CRM told a different story: three SQLs from RV manufacturers and two sample orders. Reach described the audience. The CRM described the demand.
How Do Social Algorithms Actually Work in Industrial B2B?
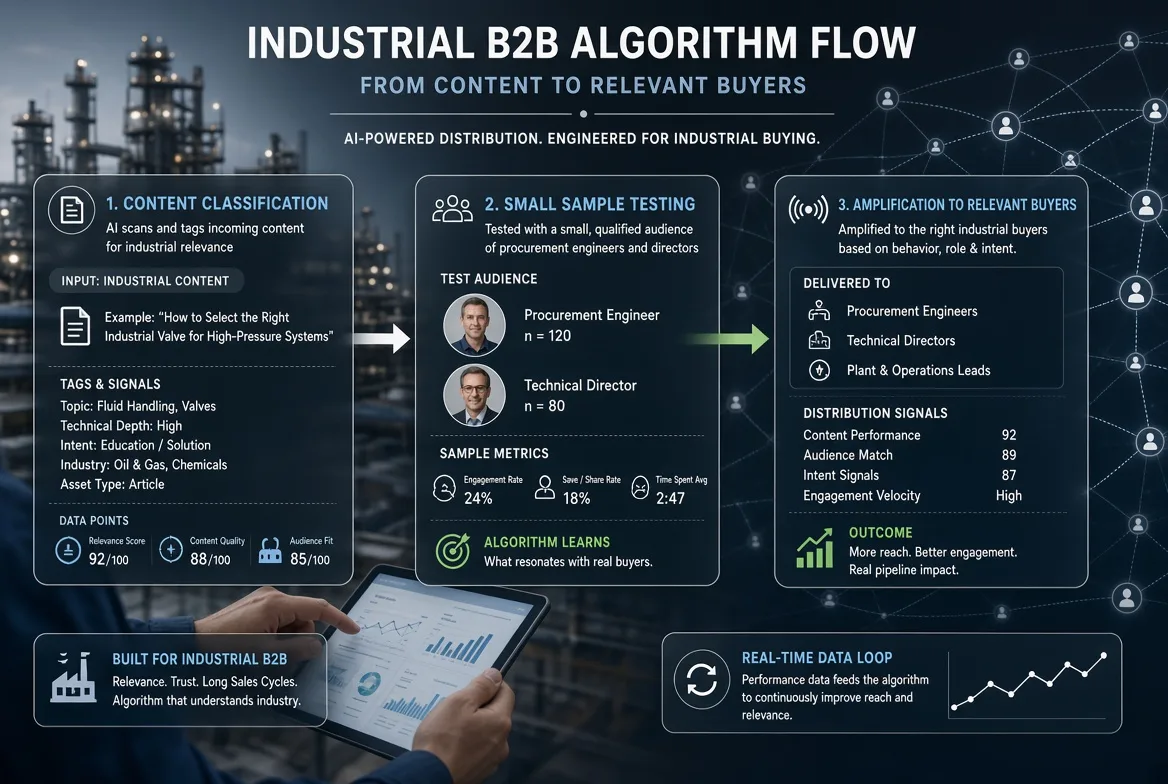
Platforms follow a fixed sequence with any post: classify the topic, sample a small audience, then decide whether to amplify. For industrial B2B, that sequence decides whether a technical post reaches procurement heads or dies inside a test pool of a few hundred people.
The supplier whose content survives the sample keeps surfacing in front of buyers who are already shortlisting. To see how that plays out before an RFQ, read the supplier vetting walkthrough.
What does a classification pass actually capture?
A platform does not know your business. It infers the subject from text, labels, media and the accounts that interact first, then returns a topic profile such as fluid handling, valves, high technical depth, education intent, oil and gas. It can also misfile an engineering post as general corporate news.
Language drives much of that inference. A post that opens with a certification number and a test standard classifies faster than one that opens with company news, so the relevance score is mostly earned in the first two lines.
💡 Diagnostic: If a technical post underperforms, check classification before blaming the topic. Copy that leads with a claim, a standard or a measured result gives the classifier something to work with.
Small Sample Testing and Distribution Signals
Once classified, the post enters a small audience of likely buyers, and its early performance decides whether the audience widens. Engagements and saves per thousand views, shares, comment depth and time spent all feed that decision.
Sample sizes stay small, often a few hundred viewers split between procurement engineers and technical directors. Amplification then targets buyers by behavior, role and intent: procurement engineers, technical directors, plant and operations leads.
This is why narrow technical topics beat broad corporate messaging in industrial B2B. A generic culture post classifies as company news and samples against a diffuse audience, while a post on CSA versus CE classification reaches engineers and buyers with a live decision.
A CSA certification post on portable water heaters reached 12,000 impressions in one trace, and the first 200 viewers were RV engineers and procurement staff.
⚙️ Technical Detail: The distribution loop is continuous. Performance data from one post feeds the next classification and sampling decision, so a topic that proves out compounds while a topic that fails quietly stops shipping.
What Does the Procurement Survey Show Buyers Consult?
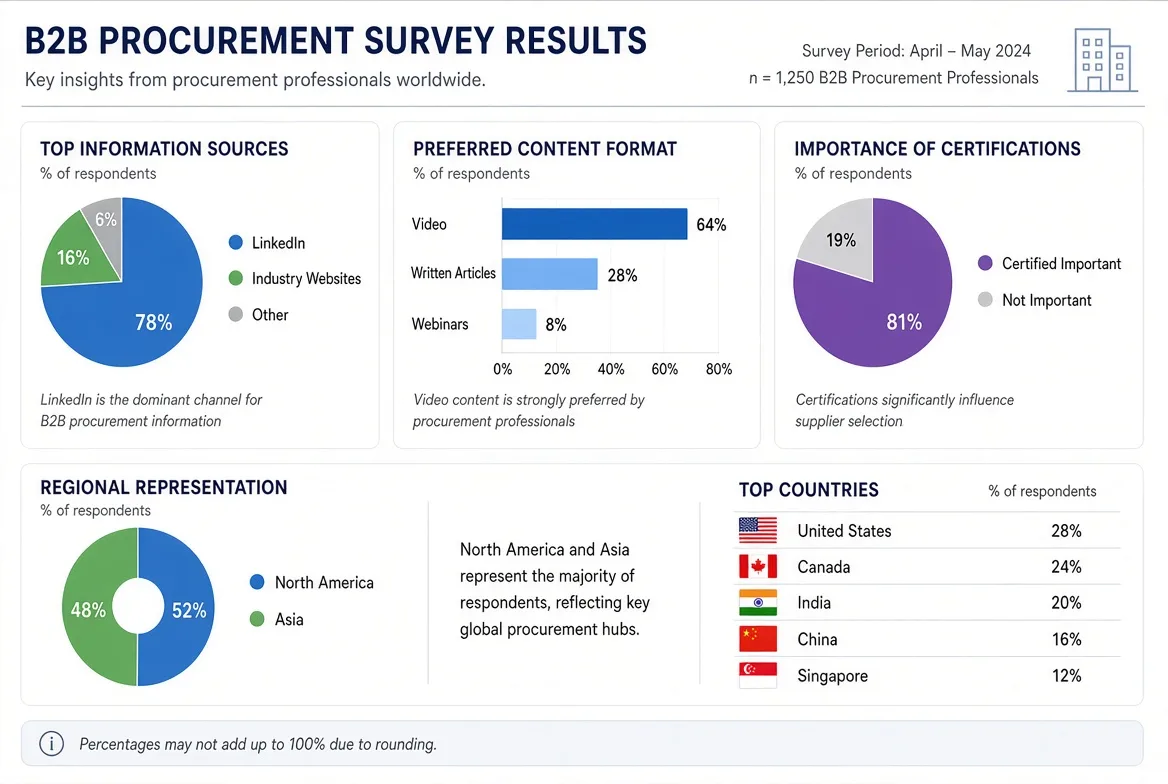
The survey ran in April and May 2024 with 1,250 B2B procurement professionals — the role the Institute for Supply Management represents — as an online questionnaire on which channels buyers consult before an RFQ. It records stated behavior, so frame a hypothesis and test it against your own CRM.
Respondents came from North America (52%) and Asia (48%). The top countries were the United States (28%), Canada (24%), India (20%), China (16%) and Singapore (12%), and three answers matter to a marketing budget.
- Professional networks: 78% consult LinkedIn or an equivalent professional network before an RFQ.
- Video proof: 64% watch video content before shortlisting suppliers.
- Certification assets: 81% review current, downloadable certification documentation.
Regional differences are directional rather than decisive, with Asian respondents leaning toward video validation and North American respondents toward certification files. LinkedIn’s own B2B research reaches the same conclusion: job-function relevance drives engagement.
The methodology, question set and weighting are published at our fact-checking process. Read them before quoting a figure in a board paper.
🔄 Common Misconception: Posting frequency does not predict RFQ volume. Only 11% of surveyed buyers check how often a supplier posts, and none of the shortlist criteria in the survey depend on cadence.
The Nine-Month Campaign Teardown
Gulfstone’s team built a nine-month campaign for a contract manufacturer, targeting 240 director-level accounts. The audience was VP of Operations and Procurement Director titles at OEM brands with $50M+ in annual revenue.
Content mixed certification explainers, plant footage, engineering Q&As and posts on pricing transparency, each linked to a two-page checklist or a three-minute tour. Sales messaged every lead within 48 hours of a form fill, referencing the specific asset the buyer had engaged with.
📈 Attribution Check: The 48-hour follow-up is what makes the rest measurable. A lead contacted against a named asset can be traced back to the post, which is what separates campaign evidence from campaign anecdote.
The result was 18 RFQs, 6 SQLs and 3 closed contracts worth $14M, with certification explainers driving 42% of RFQs. Plant footage produced profile visits but fewer form submissions, because buyers wanted the document before committing a name and an email.
🧠 Expert Insight: The most valuable social statistic is not reach. It is the number of RFQs influenced by social content in the last 90 days — a figure only the CRM can produce.
Key Benefits
LinkedIn is becoming a distribution moat for industrial teams, but only when the measurement is platform-specific, because blended averages hide the differences that matter. Better prioritization, credible benchmarking and tighter sales alignment all follow from reading each channel against the funnel stage it serves.
Better Executive Prioritization
Platform data shows where leadership time and subject-matter expertise produce a return, and the survey puts professional networks ahead of every other pre-RFQ channel at 78%.
The teardown shows the cost of ignoring that split: certification explainers produced 42% of RFQs, while factory footage produced profile visits and few forms. Both are useful, but they sit at different stages and belong in different budget lines, so a board that funds reach while expecting RFQs is defending the wrong number.
🚀 Strategic Insight: Compare opportunity rates, not blended averages. Lower reach on LinkedIn often outperforms higher reach on a short-form feed when the measure is sales-qualified leads.
More Credible Competitive Benchmarking
Comparing platforms side by side only works when the comparison respects what each platform is for. LinkedIn lead-gen forms reduce friction and lift form-fill rates against external landing pages, video carries factory validation proof, and X carries industry commentary while rarely producing RFQs.
The teardown puts numbers on the first two: LinkedIn produced 6 SQLs from 18 RFQs, while X produced 12,000 impressions and zero SQLs over the same test window. Treat those as within-program figures, not market benchmarks.
Importers and OEMs should read them as a shape, not a target. For buyers weighing regional entry paths, the supplier relationship options cover how an OEM, importer or distributor program starts.
Stronger Sales and Marketing Alignment
Native forms capture intent without a redirect, and LinkedIn’s lead-generation formats are built around that, so sales can follow up against the exact proof asset the buyer reviewed. That reference changes the call, because a buyer who saved a certification checklist gets a different opening than one who watched a factory tour.
Transparency also lowers perceived supplier risk. Operating clarity shows process discipline before the buyer sends an email, and the quality control gates page is the document set those walkthroughs point back to.
Kingsley put it plainly: “When we share operating clarity such as QC walkthroughs and certification checklists on professional networks, cross-border buyers see process discipline before they send an email. That lowers perceived risk and shrinks the trust gap by weeks.”
Challenges and Limitations
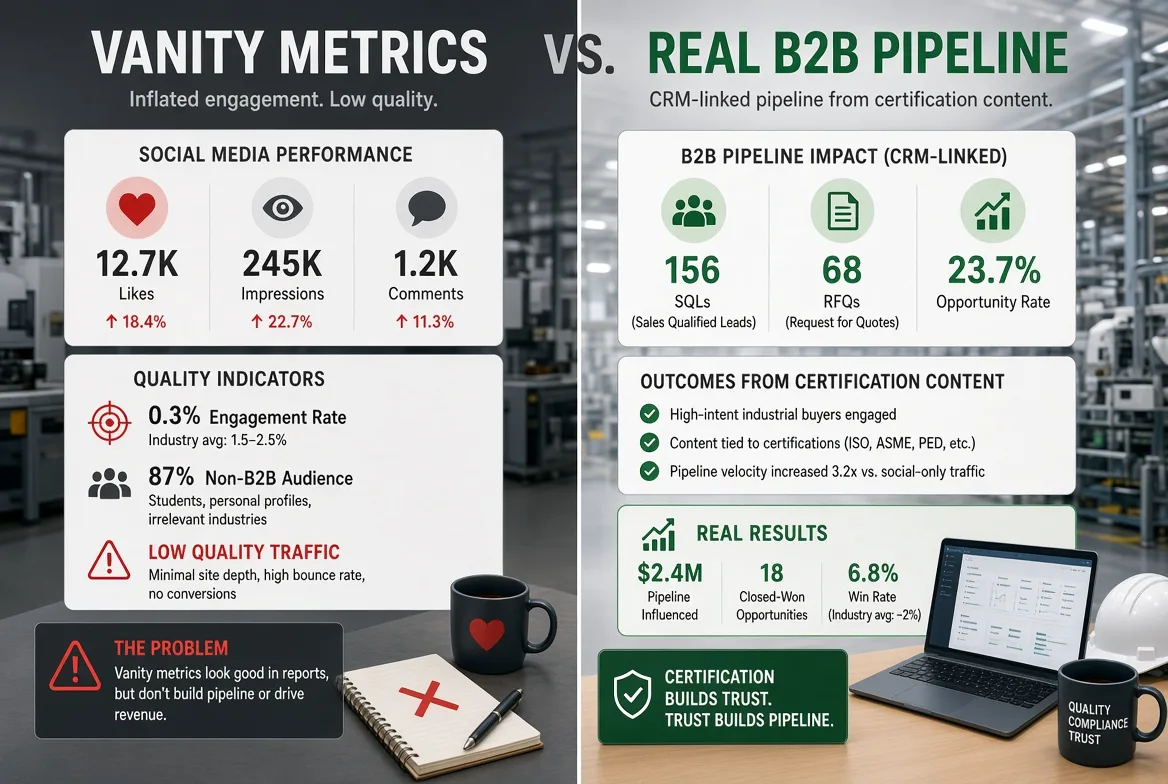
The most common mistake is reading impressions and likes as proof of qualified demand. It inflates confidence in a channel that only shapes early awareness, and spends budget where the buyer has no authority to act yet.
Vanity Metrics and Attribution Leakage
The survey finds that 11% of buyers check how often a supplier posts, yet many marketing teams still report reach as a primary KPI. A product showcase post without buyer context produced 12,000 impressions and zero SQLs, while a certification explainer with 4,200 impressions produced three SQLs.
Long sales cycles make this worse, because social can shape a shortlist and receive no last-click credit for it — a gap the Salesforce State of Sales research tracks across B2B teams. In the teardown, 42% of RFQs traced back to certification content while last-click attribution credited a later Google search.
🛡️ Mitigation Strategy: Track opportunity rate (SQLs divided by leads) and assisted pipeline. Filter audiences for director-level buyers, compare like with like, and treat conclusions as directional until CRM data confirms them.
Benchmark Variance and Executive Mistakes
Benchmarks shift with audience size, content format, paid versus organic mix, geography and deal complexity. Four mistakes recur in reviews.
- Comparing against a consumer creator. A page with a tenth of the followers can still deliver more RFQs.
- Mixing paid and organic. Boosted reach and organic sample performance are different signals.
- Treating one quarter as stable. A single strong month can be a topic hit, not a program.
- Overreading platform averages. An average hides whether the SQLs matched your ideal customer.
One client benchmarked against a creator account with ten times the followers and no procurement decision-makers in its audience, and the comparison produced no usable conclusion. X is the fair reverse case: it underperforms on conversion yet still earns a listening budget for industry dialogue.
Every figure above carries a caveat, because the survey records what buyers say they do and the teardown records what one program achieved. The CRM still linked 156 SQLs and 68 RFQs to certification content, which is a number no like count can produce.
Final Thoughts
Social media statistics become strategically useful only when they tie to buying behavior, supplier trust and pipeline progression. Adoption data sets the context, while proprietary survey results, channel benchmarks and CRM-linked outcomes drive the decisions.
Vanity metrics and attribution leakage remain the two persistent failures. The evidence still points one way: 4,200 impressions produced three SQLs, while 12,000 impressions produced none.
The operating model is narrow. Align one proof-focused message across every channel, then hold a scorecard of four numbers: opportunity rate, RFQ influence, assisted pipeline and form-fill rate. If a channel cannot move one of the four, fund it like a listening channel.
This guide draws on a procurement survey of 1,250 respondents, a nine-month campaign teardown and an interview with Gulfstone’s Operations manager. It names no social platform or manufacturer as a sponsor.
If the work is to interpret benchmark data, reduce perceived supplier risk or build a proof-led program, the contact page is the place to start. These findings reflect internal program experience and the published survey, and I receive no manufacturer kickbacks for these findings.
Frequently Asked Questions About Industrial B2B Social Media Metrics
1. What does each social media metric mean?
Each metric is a measurable signal behind a dashboard label: reach, attention, interaction, traffic, lead capture and revenue influence. Read account-level health separately from content-level performance, and judge both against audience quality, deal size and buying stage.
2. How do social algorithms actually work?
Social algorithms classify a post by topic, test it with a small sample of relevant users and scale distribution only if early signals are strong. For industrial B2B, narrow technical topics beat broad corporate messaging because credible hooks earn the early clicks, comments or watch time.
3. Are LinkedIn lead-gen forms better?
LinkedIn lead-gen forms reduce friction and lift form-fill rates because native forms capture intent without sending users to an external landing page. Sales can follow up against the specific proof asset the buyer viewed, and the resulting SQLs still need validating against budget, authority, need and timeline.
4. Does social media drive B2B pipeline?
Social media moves B2B pipeline when you track opportunity rate, RFQ influence and assisted pipeline instead of raw reach. In the nine-month teardown, LinkedIn produced 6 SQLs from 18 RFQs and certification explainers drove 42% of RFQs, while long cycles still pushed last-click credit to a later search.
5. What is a good LinkedIn engagement rate?
There is no universal good engagement rate, because benchmarks depend on audience quality, deal size and buying stage. Industrial teams should not compare themselves to consumer creators, so measure against similar firms and funnel stages, then fund the proof assets that earn saves and shares from procurement staff.
6. Why do B2B brands need social media?
Procurement teams use these channels to discover, validate and shortlist suppliers before releasing an RFQ. In the survey, 78% consult professional networks before an RFQ and 81% review current certification files, and proof-led content lowers perceived supplier risk while shortening the trust-building cycle.

Forward
Co-founder & General Manager, GulfstoneGas appliance manufacturing and certification
Most of what decides a gas appliance is settled before anything is built — on the drawing, at the cut-out, in the tolerance someone chose for the gas path. I have spent my working life on the manufacturing side of that decision, and this is where I write down what it has taught me.
Nothing here is written from a sales desk. Every note comes off the floor: a batch held until a reason was found, a fitting that failed in transit, an approval path that only made sense once the destination market was fixed. If you read these first, the opening conversation starts at the standard rather than at the beginning.
- Gas water heater engineering
- Design for manufacturing
- Certification path selection
- Private-label tooling
- Off-grid and outdoor water heating
- Top 8 Outdoor Portable Gas Water Heater Factories in China for B2B BuyersNov 4, 2026
- Custom RV Appliance Industrial Design: An OEM Brief to a Validated PrototypeNov 3, 2026
- How to Build Custom Thermostat UI Design Software for OEM Embedded PanelsNov 3, 2026
- Top 8 RV Water Heater OEM Suppliers Canada: Vetted for Volume BuyersNov 3, 2026
- Top 10 Portable Propane Water Heater Manufacturers USA: A No-Hype Buyer ShortlistNov 2, 2026
- PPWR Compliance Checklist for EU Water Heater Packaging: The 10 Documents Before the Container LoadsNov 2, 2026
Fifteen years in appliance manufacturing — home appliances, RV refrigeration, then gas water heating — from the drawing to the shipping container.
Leads Gulfstone's design-for-manufacturing reviews and the certification path selected for each destination market.
Works directly with OEM and private-label buyers on tooling, tolerances and the approval file.